Mollier diagram
A Mollier diagram is the name given to a chart that describes the properties of a gas and has enthalpy as one of its scales. Mollier diagrams exist for steam, refrigerants and air for example. Here the focus is on air. Technically, the Mollier diagram for humid air is a psychrometric chart, which is the term generally used for it in English speaking countries.
The diagram is used to illustrate heating, cooling and humidification processes. We can see the effect of the process and we can see how it relates to requirements for the comfort conditions in the room, for example.

History
Richard Mollier was a German professor of Applied Physics and Mechanics and a pioneer of research in thermodynamics, particularly for water, steam and moist air. He created a diagram in 1904, when he plotted the total heat H against entropy S. At the 1923 Thermodynamics Conference it was decided to name any thermodynamic diagram using enthalpy as one of its axes "Mollier diagram", in his honor.
Mollier diagrams are used by engineers in the design work associated with power plants, compressors, steam turbines, refrigeration systems and air conditioning equipment to visualize the working cycles of thermodynamic systems.
Source: Wikipedia
Properties of air
It is important to understand the properties of air and what they are used for.
Dry air
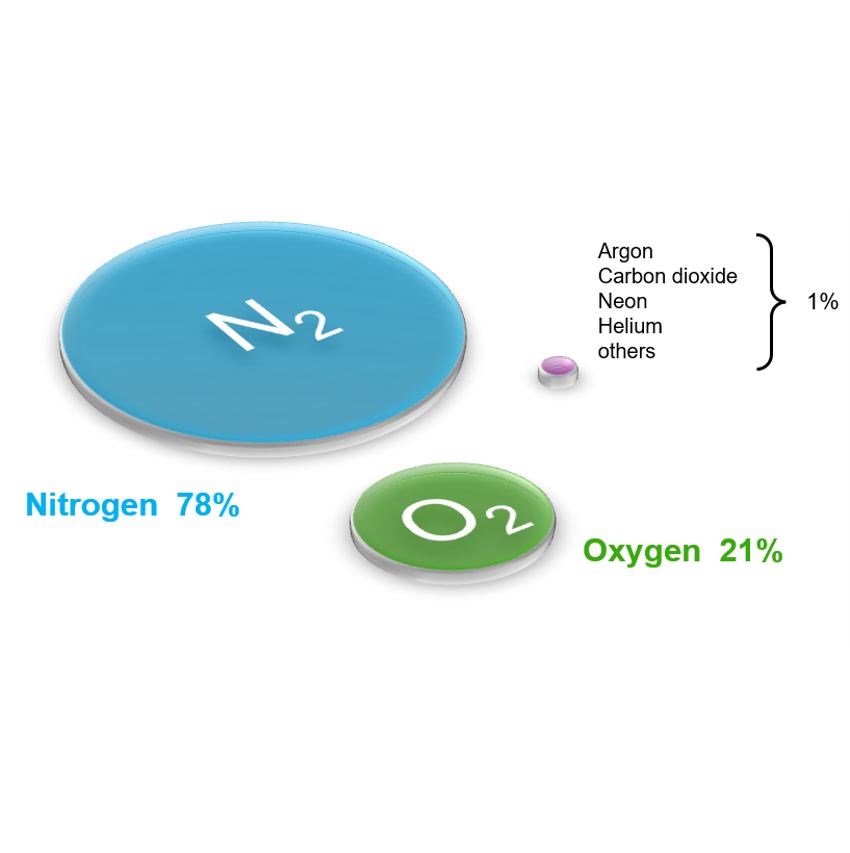
Dry air is made up of a mixture of gases. 78% is Nitrogen, 21% is Oxygen and the remaining 1% is made up of gases such as carbon dioxide, argon, neon, helium etc. Dry air is mixed with an amount of water vapour up to about 4%.
Humid air
The main physical properties of humid air that needs to be consider are:
- Temperature
- Pressure
- Humidity
- Density
- Enthalpy
The Mollier diagram describes the enthalpy, humidity and temperature at a fixed density and pressure. Read more about the properties of humid air below.

Composition of dry air
Properties of humid air
The Mollier diagram layout
Relative humidity and enthalpy are plotted in a diagram against temperature and specific humidity to form the Mollier diagram. The curved lines in the diagram are relative humidity while the diagonal lines are enthalpy.
The left hand diagram is the Mollier diagram used in many countries. The right hand diagram is normally called a Psychrometric chart and is used in most English speaking countries. The diagrams are really the same – they give the same results but the temperature and specific humidity scales are reversed.

Mollier diagrams for typical HVAC system processes
The diagram is used to illustrate heating, cooling and humidification processes. The effect of the process is visualised as well as how it relates to requirements for the comfort conditions in the room.
The equations used to plot the Mollier chart are used in selection programs to calculate the results such as the change in temperature and humidity, as well as power consumption etc.
Learn more and see diagrams of typical processes used in HVAC systems
The Swegon Mollier diagram
The Swegon Mollier tool is a web based program.
Additional information
Relative humidity is an important aspect of indoor climate.
The video to the left explains how humidity affects both buildings and human health. To learn more about the importance of correct humidity levels for an optimal indoor climate, please explore below resources: